
Helping a Pharmaceutical Company Create More Relevant Services for Pharmacies through a Value-based Segmentation
My role
Service & Visual Designer
Team
Johanna Lamberg (Service designer) & Emilia Gustafsson (CX lead)
Context
This pharmaceutical client was not a one-off project: at Hellon, we had worked together across several projects before this one, which meant we had context on how decisions actually got made internally, which stakeholders needed to feel involved early and where the unofficial tensions sat. That history shaped how we approached the work from the start.
All visuals are redesigned versions of client deliverables, recreated without proprietary data or content for portfolio purposes. The illustrations are hand-drawn by me.
Background
The client, a pharmaceutical company (confidential), relied heavily on field representatives to support and distribute the company's products to pharmacies across Finland. It had worked well for a long time, but the return on that investment had been quietly declining, and nobody had formally sat down to question the model.
Their existing model treated pharmacies largely the same, resulting in inefficiencies and unclear impact. A pharmacy manager focused on business growth needs something completely different from a pharmacist focused on day-to-day operations. The client knew this intuitively, but their support model didn't reflect it.
They wanted to change that, but didn't yet have the data or structure to know how.
Design opportunity
How might we help field representatives prioritise the right pharmacies, in the right way, based on actual needs rather than habit?
Hellon
My role: Service & Visual Designer
Team: Emma Hertzberg & Lotta Salminen
Phase 1 - Understanding the context through research & making sure everyone's onboard
Understanding the client
Even though we had worked with this client before, we still started by mapping out what existed: their service offerings, how representatives operated and what internal documents said about pharmacy relationships. The goal wasn't to discover something new, but more about getting everyone looking at the same picture.
I ran stakeholder interviews with the sales team and management to capture how things actually worked day-to-day, and where the friction was. I also went through internal documents and reports to complement what came up in the conversations.
This project touched a lot of people's work. Sales targets, marketing strategy, the daily routines of representatives who had been doing things the same way for years. Not everyone agreed on what the problem was, also some weren't sure there was one.
Thus, alongside the research, we ran alignment sessions with the client to define what we were actually trying to solve: goals, expectations, what success would look like. That way we weren't relitigating the problem statement at the end when we had actual findings to work with.
One thing we'd do differently: we got the client team aligned early, but we should have involved the field representatives already at this phase of the process. Bringing them in earlier would have saved time and the adoption phase would have gone more smoothly.
.jpg)
5
Interviews with sales team
1
project kickoff
3 Client documents & reports
.jpg)
26
In-depth interviews
Identifying patterns by affinitiny clustering
Understanding the pharmacies
Pharmacies have different kind of roles: Managers, pharmacists, cosmetologists - each with different responsibilities and different perspectives about what good support from a representative looks like. We needed to understand those differences before we could design anything.
We started with pharmacy managers as they were the decision-makers who determined how the pharmacy operated and how much they valued the client's representatives. If the segmentation was going to change anything, it had to start here.
This type of segmentation work is typically done with surveys, with a minimum of 500 responses. There are around 600 pharmacy managers in Finland, which means we would have needed almost every single one of them to respond.
Instead, we did 26 in-depth interviews. It was more time-consuming to run and analyse, but as the interviews went deep into the day-to-day reality of running a pharmacy, we came out of this phase with a much richer base of knowledge than numbers alone would have given us.
I designed the interview structure, took part in the sessions and together with Johanna we synthesised the findings. Afterwards we went through everything together as a team in Miro, clustering the insights until patterns started to emerge. Those patterns became the first version of the segmentation.
Scaling the research
After 26 interviews with pharmacy managers, we had a solid understanding of how pharmacies operated. One thing that we learned was that managers aren't always the ones running things day-to-day. In many pharmacies, pharmacists take on that role: handling operations while the manager focuses elsewhere. Our next step was to focus on this group.
With around 10,000 pharmacists in Finland, we were able to build a survey as the population was large enough to get meaningful numbers. I co-created the survey with the team and we got over 500 responses. We ran the data through an internal AI tool to cluster the findings into groups, which complemented what we had learned from the manager interviews and gave us a much broader view of the user base.
What was interesting was how much the pharmacist segments mirrored the manager segments. The same types kept appearing: the ambitious ones who wanted to develop the pharmacy further, the ones who cared most about customer experience, the ones who were stretched thin and just needed efficient, no-fuss support. Different job titles, same underlying needs and motivations.
We eventually used the same approach for the other roles in the pharmacy too: cosmetologists and other staff. Each group had a different relationship with the client's representatives, and it mattered to have the full picture. For this case study I'm focusing on managers and pharmacists, as they were the two groups that shaped the segmentation most.
.jpg)
Over 500 survey responses
Phase 2 - synthesising the research findings into segments and tools
Creating the segments
To ensure the insights could be used beyond the project team, we focused on translating the findings into practical tools for the organisation.
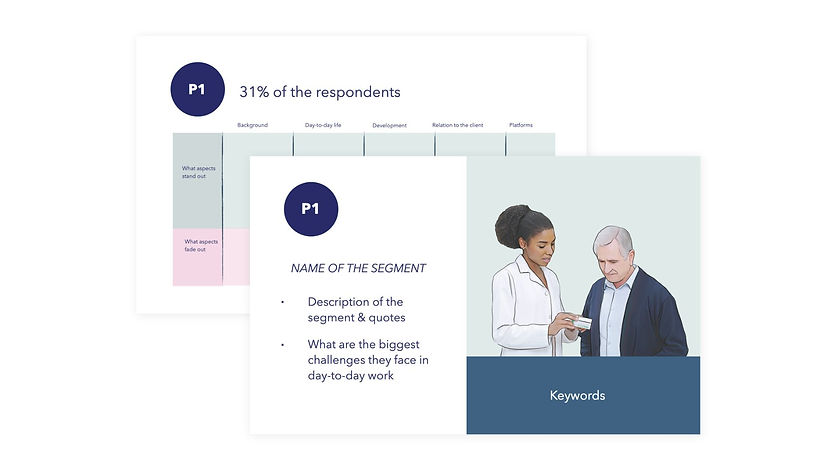
Together with Johanna we translated the research findings into segment profiles - one for each of the 12 segments we identified across the different pharmacy roles. Each profile captured the essentials: their responsibilities, their challenges, what they were trying to develop, how they perceived the client's representatives, and how they engaged with digital platforms. We also included a short snapshot of what a typical day looked like for each segment.
The profiles were designed to feel approachable. We took cues from digital interfaces: visual hierarchies, clear structure, a consistent format across all segments. The goal was something our client could pick up and immediately recognise someone they knew from their work.
Visualised profiles capturing key needs and challenges
Building the service model
With all the segments mapped, we could start connecting them to how the client actually operated. The first step was giving the organisation a way to prioritise. We built a tier model that placed each segment into a clear hierarchy: which groups needed high-touch, in-person support from representatives, which were better served digitally and which sat somewhere in between. This gave the client something they hadn't had before: a shared logic for making decisions consistently, across both sales and marketing.
We also built a positioning matrix to show how the segments related to each other. Where they overlapped, where they diverged, and what that meant for how the client should allocate their efforts.
Throughout the materials we included direct recommendations, not structural changes to the whole service system, but concrete starting points. Some of them were grounded in anonymised quotes from the research, which meant the recommendations weren't just our interpretation. They came directly from the people the client was trying to serve. One of the risks with a project like this is that the client receives a framework that feels theoretical. Anchoring the recommendations in real voices from the field made them harder to dismiss.
The materials were built incrementally: managers first, then pharmacists, then the remaining roles. Each time a new group was researched, the model was updated. By the end, the segmentation and the service model had grown together rather than one following the other.

Positioning matrix
.jpg)
Strategic–tactical–operational framework
Phase 3 - Presenting the findings and feedback
.jpg)
3 Internal presentations and validating meetings
Creating space for discussion and reflection
Driving adoption
We presented the findings first to the marketing director and their team, then took it to the field representatives in two separate sessions. Those sessions were the most rewarding part of the whole project: Some people were nudging each other across the room - "you know who I'm thinking about" - while presenting the segments. That kind of reaction was communicating that we had been able to capture something real and relatable.
The response was largely positive and most representatives were on board, but not everyone. There were those who were sceptical, and some who were resistant to changing the way they had always worked. Looking back, that was partly on us. We had involved representatives at the end of the process as an audience for the outcomes rather than as contributors to the work itself. The ones who pushed back weren't wrong to. They hadn't been part of building it.
It's the one thing I would do differently. The recognition in the room told us the segmentation was accurate but the resistance told us the process had been maybe too closed.
Phase 4 - Outcomes
The outcomes
The segmentation and all the frameworks that came out of it were combined into a service handbook. The goal was to make everything as practical as possible: not a research report that would sit in a shared drive, but something the organisation could actually use.
The handbook brought together the customer segments, the tier model, the positioning matrix and the recommendations in one place. It gave the client a shared language for talking about their customers and a clear logic for deciding how to serve them.
Changing how an organisation works doesn't happen overnight. There are other parts of the service system still being developed, and turning a framework into new habits takes time. But that was never the expectation for this project. The goal was to give the representatives, sales and marketing a common foundation to build from a clear picture of who their customers are and what they actually need.
.jpg)
A practical service handbook
Clearer strategic prioritisation of customer support
Recommendations and suggestions of future improvements
Reflections
This was one of the first client projects where I worked closely with a wide set of stakeholders, and it sharpened my understanding of how central that work is to creating real change. I started to see that progress rarely comes from deliverables alone, but from how well you’re able to align people around them.
In practice, a large part of the work was not just research or production, but creating space for conversations where different perspectives could surface and be worked through. I paid attention to how insights land, what gets picked up and where alignment starts to form. That influenced how I structured outputs and facilitated discussions throughout the project.
Working as an external consultant added an interesting dynamic. We often got very direct input in interviews that might not have surfaced internally, which made it important to translate and frame what we heard in a way that was constructive rather than just transparent. At the same time, earning trust was an ongoing part of the work, not something that happens automatically when you’re brought in from the outside.
Over time, I became more confident in facilitating workshops and leading conversations where there wasn’t always a clear agreement at the start. I started to take a more active role in shaping those situations rather than just supporting them.
Looking at how AI is changing parts of design and research work, I see these skills becoming even more important. The ability to build trust, read group dynamics, and move conversations forward is something I now consider core to my role as a designer, not a secondary skill set.
Selected Work 02

Making International Expansion Clearer and More Approachable for Finnish Businesses
- Case Team Finland
My role
Background
Service & Visual Designer
Team
Lotta Salminen (Service designer) & Emma Hertzberg (Design lead)
Context
This was my first project with the client, so I came in without much prior context. In hindsight, that was an advantage. Looking at the services through fresh eyes made it easier to spot areas that were unclear and to ask questions that long-time stakeholders no longer thought to ask.
The resulting service journey was published by Team Finland as a shared visualisation of the internationalisation service ecosystem and can be viewed here
Team Finland is a network of organisations that support Finnish companies with international growth, including Business Finland, ELY Centres, Finnvera, and other public sector actors.
Over time, the service offering had expanded and become difficult to navigate. Companies could access support through multiple organisations, but it was not always clear where to start or how different services related to each other. There were overlaps between organisations, and even the service providers themselves found it challenging to explain the overall ecosystem.
The goal of this project was to create a shared view of the customer journey and make the service landscape easier to understand. By visualising the end-to-end experience, we helped stakeholders identify gaps, overlaps, and opportunities for better coordination across the network.
Design opportunity
How might we make the internationalisation services clear and easy to navigate for the companies using them and the organisations delivering them?
Phase 1 - Understanding the context through research & making sure everyone's onboard
Understanding the ecosystem
We started by building an understanding of the service ecosystem from the providers' perspective. Before talking to companies, it was important to understand how the different organisations within Team Finland saw the services they offered and how they believed those services connected to each other.
I conducted stakeholder interviews with representatives across the Team Finland network, starting with the core project team and continuing with different organisations involved in internationalisation support. One of the first observations was that there wasn't a single shared view of the ecosystem. Different organisations described services, roles, and customer needs in different ways, which made the overall picture difficult to communicate both internally and externally.
As a new client, there was also a steep learning curve. Many of the people we interviewed had worked within the ecosystem for years, while we were trying to understand it in a matter of weeks. This required asking a lot of fundamental questions and continuously validating our understanding along the way.
Interestingly, approaching the ecosystem with fresh eyes proved valuable. Questions that seemed basic to us often revealed assumptions that had become embedded in the organisations' day-to-day work and were no longer being challenged.
The stakeholder interviews helped us build an initial view of the customer journey, identify key stages in the internationalisation process, and highlight areas where the service offering appeared fragmented. These early hypotheses later guided the customer research phase, where we tested them with companies using the services.
5 Client documents & reports

7 Interviews
with TF re-presentatives
Phase 2 - Validating the initial journey with companies

21 online in-depth interviews with client companies
Gathering feedback on structure and content
Validating and shaping the service journey
Once we had an initial understanding of the ecosystem from the stakeholder interviews, we wanted to see how it matched the experiences of the companies using the services.
Based on the insights gathered so far, I built a first version of the service journey in Miro. We used it as a discussion tool during the interviews, asking participants to react to the journey rather than describe everything from scratch. This made it easier to spot what felt familiar, what was missing, and where our assumptions were wrong.
The interviews took place online during the COVID-19 period, and 21 companies participated. Their perspective brought an important layer to the work. While the organisations had a good understanding of the services they provided, the companies spoke about the challenges they were actually trying to solve and how they navigated the support available to them.
There were several places where the two perspectives didn't fully match. Services that seemed clear from an organisational point of view were not always easy for companies to find or understand. In some cases, companies weren't looking for a specific service at all. They were looking for help with a business challenge and didn't necessarily know which organisation could support them.
These conversations helped us refine the journey, validate some of our initial assumptions, and identify gaps that were not visible from the provider perspective alone.

Defining the journey
After the stakeholder and company interviews, we brought the findings together and started looking for patterns across the data.
One of the main tasks was defining a journey structure that reflected how companies experience internationalisation in practice. The existing services were organised by different organisations and programmes, but that wasn't how companies described their experience. Instead, they talked about goals, challenges, and decisions they faced as they expanded into new markets.
Based on the research, we defined six stages that captured the internationalisation journey from the company's perspective. This became the backbone of the final service journey and helped organise a complex ecosystem into a format that was easier to understand and communicate.
The structure also created a shared reference point for the different organisations involved. It helped connect services across organisational boundaries and made it easier to discuss where support existed, where overlaps occurred, and where companies were still falling through the gaps.
The journey was structured into six stages
Capturing the companies perspective
Phase 3 - Final visualisation
Phase 2 - Validating the initial journey with companies
Visualising the journey
Validating final visual with client companies
Once the journey structure was defined, we started translating it into a visual format that could communicate the ecosystem clearly to both companies and service providers.
One of the key design challenges was representing internationalisation as an ongoing process rather than a linear sequence of steps. Early concepts followed a traditional journey format, but they suggested a beginning and an end, which did not reflect how companies described their experience. In reality, companies often revisit earlier activities, enter new markets, and continue developing their international presence over time.
Together with another service designer, I explored different ways of visualising this. The final concept used a looping structure for the later stages of the journey, helping to communicate the continuous nature of international growth while keeping the overall journey easy to follow.
Another consideration was that companies do not all follow the same path. Depending on their size, maturity, and goals, they may enter the ecosystem at different points or use different services. We wanted the visual to acknowledge this flexibility without making it overly complex.
The final journey also brought together the different organisations within the Team Finland network, showing what support was available at each stage and how the organisations contributed to the overall experience. A key objective was to make the ecosystem easier to understand as a whole, rather than presenting each service in isolation.
The visual was developed iteratively in Illustrator and refined through feedback sessions with Team Finland stakeholders. Once completed, it was shared with participating companies, who recognised their own experiences in the journey and found it easy to understand and navigate.

A note on what's here
Four years of agency work means most of my work lives behind NDA's. What's shown here represents the projects I was able to anonymise or share openly, but it's a small window into the full scope.
If you're curious about specific types of work, I'm happy to walk you through more in a conversation.